Introduction Starting IRIS2000
Navigating the Data Set
- Changing the Visible Cross Sections
- Using the Cross Hairs Button
- Navigation within a Cross Section
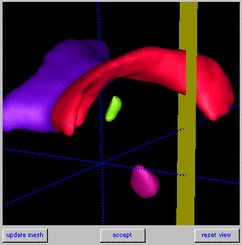
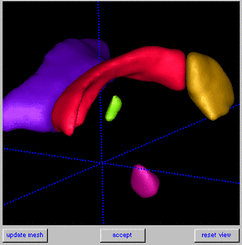
- Rotating and Zooming in the 3D Window
Creating Segmentation Image Data with Polygons
Editing Segmentation Image in the 3D Window
The IRIS 2000 systemIRIS is a cross-platform system that is intended help doctors, medical technicians or medical researchers create 3D models of structures within the brain. A user could also use IRIS to build a 3D model of a structure from any volumetric data set (called image segmentation.) IRIS allows users to load data taken from MRIs or similar images, and displays the data in 4 windows. Three windows show the 3 orthogonal (2D) cross-sections and the fourth windows shows the 3D image. In order to produce an image segmentation (a 3D structure within the larger image,) parallel cross-sections of the data set must be examined, and the shape of structure visible in these cross-sections must be outlined with the aid of the drawing tools provided by IRIS. The parallel outlines from each of these "slices" is then examined and used to produce a 3D image in the 3D window. What is Image Segmentation?Image segmentation refers to a process of examining cross-sections of a volumetric data set, and outlining the shape of structure visible in these cross-sections. After the structure has been outlined in a set of parallel cross-sections, the outlines can be stacked together to approximate the 3D-shape of the structure. Who uses Image Segmentation?The intended users are doctors, medical technicians, medical researchers, anyone who needs to build a 3D model of a structure from a volumetric data set. About/BackgroundThe IRIS 2000 project attempts to extend a medical imaging tool, IRIS, that was implemented as a COMP145 project in 1999. The previous version of the software is used to create a segmentation of a 3D data set, that is composed of 2D slices. It allows for the segmentation of data sets in these 2D slices and provides a 3D rendering of the data. The project goals specifically address the extention of the 3D display and manipulation capabilities of the system. IRIS 2000 continues to be platform independent and portable for use on all the major architectures used within the Computer Science department that have appropriate supporting libraries (Sun-Solaris, SGI, and Windows NT.) Glossary
Unix: In the program directory, type 'iris' at the command prompt NT: From the program folder, double click on the 'iriswin32.exe' icon. A menu bar, toolbar, and four windows should appear. The top two and bottom right windows are used to display 2D orthogonal cross-sections of the volumetric data set. The bottom left window is used for displaying a structure segmented in the three 2D windows. Loading Grey DataFrom the file menu, select Load -> Grey Data. The load box should appear.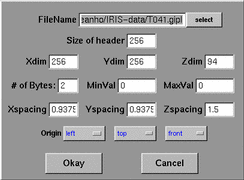
After loading, the three 2D windows should display default orthogonal views. The 3-D view will remain empty. Loading Segmentation DataFrom the file menu, select Load -> SegFile. The segmentation file load box should appear.
Saving Segmentation DataTo save the current work, select Save -> SegFile from the file menu.
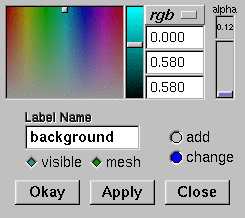
Loading Label DescriptionsThe segmentation data by itself only associates integer tags (labels) with each voxel. It is useful to associate names to the various tags; this data is stored separately in a label description text file. This file also stores the RGBA color value associated with each label, as well as visibility flags and other flags associated with the labels.From the file menu, select Load -> LabelFile.
Saving Label DescriptionsThe label descriptions (names, RGBA values, visibility, etc.) can also be saved to a text file. To save the current set of color labels, select Save -> LabelFile from the file menu.
A Note on the 3D RenderingThe process of extracting a 3D visualization of the segmentation data is computationally intensive, so by default the 3D meshes are not automatically generated upon load of a segmentation image or a label description set. At any time, pressing the 'update mesh' button on the 3D window will generate meshes for all valid colors which have the 'mesh' toggle switch on. See the section on updating the 3D mesh for more information.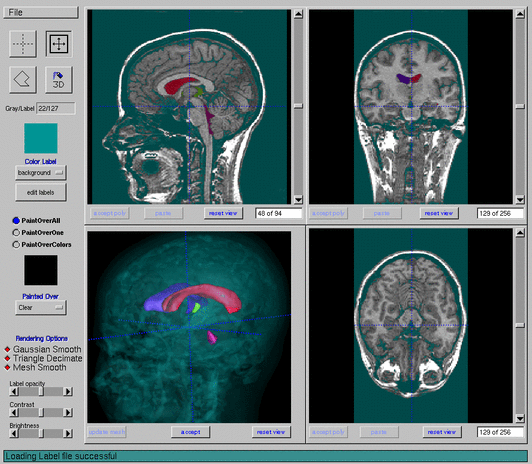 Display of the Volumetric Data SetData Set and Window OrientationThe volumetric data set is a 3D array of intensities, such as the density map of a volume from an MRI scan. The cells in the 3D array are referenced by three indices, an x, y, and z, giving the cell's offset from one of the corners in the three array dimensions. An integer unit step in a particular dimension of the 3D array corresponds to a real distance in space. In general, each dimension may have a different ratio of integer step and real distance.  Each of the three 2D windows displays an orthogonal cross-section of the volumetric data set. The upper left window displays cross-sections perpendicular to the z-axis. Therefore, the axes of this window are x and y. The upper right window displays cross-sections perpendicular to the x-axis. The axes of this window are z and y. Lastly, the lower right window displays the cross sections perpendicular to the y-axis, with axes of z and x.  Contrast and Brightness AdjustmentAt the bottom of the toolbar are two sliders, one each for contrast and brightness, applied to the display of the grey image. They initialize at the median values. Surface smoothing and simplificationAs an aid to visualization of the segmented objects in 3D, IRIS provides smoothing and decimation routines. The default settings blur binary segmentation images with a standard deviation of 1.5 pixels. To adjust the level of smoothing, select 'Options' from the 'Rendering' menu. A pop-up window allows the user to adjust parameters controlling the smoothing and mesh simplification. Remember to press 'update mesh' to reexecute the rendering pipieline. 
Changing the Visible Cross SectionsA key feature of IRIS is the ability to navigate through the volumetric data set in any of the orthogonal slice windows. It is also important to keep track of the position of each orthogonal slice relative to the other two slices. IRIS incorporates a linked cursor system that allows the user to track a single voxel as well as the position of each orthogonal slice relative to the other two. After a volumetric data set is loaded, each 2D window will display a different slice orthogonal to one of three directions, x, y, or z. Within a 2D window, the position of each of the other two orthogonal slices is represented by a blue line. The default position for the x,y, and z-planes is at the top and sides of the volumetric data set. Changing the slice in any window is immediately reflected by the movement of the appropriate blue lines in the other two windows. Next to each 2D window is a scrollbar that allows the slices to move forward and backward, one slice at a time, in the direction orthogonal to the plane displayed in that window. (If the user clicks at a point in the middle of the scrollbar, it will jump to this relative position in the set of slices in the given dimension). Below the scrollbar is a counter that displays which slice is currently being shown and how many total slices exist in that plane.  Using the Cross Hairs Button
The slices may also be shifted by choosing the crosshair button on the toolbar and clicking on a point in any of the three 2D windows. The coordinates of the point chosen in one window will dictate which slices will be shown in the other windows. For example, if an (x,y) coordinate pair is selected in the z-plane window, the other two windows will update to show the x and y planes matching that coordinate. Simultaneously holding down the left mouse button and dragging the mouse across one window does not cause the other two windows to update until the mouse button is released. If the user clicks on a point of the segmentation data in the 3-D window, the crosshairs will automatically jump to the closest point on the visible surface of the data set. The corresponding views in each of the 2-D windows will also be immediately updated. Navigation within a Cross Section
Zooming and panning in the cross sections can be performed after pressing the navigation button in the toolbar. The left mouse button allows the user to pan the currently displayed slice image in each 2D window. When the left mouse button is pressed and held in any 2D window, moving the mouse will move the displayed image with the mouse. The right mouse facilitates zooming in and out of the displayed image. Clicking the right mouse button on a slice image will zoom into that image at the position clicked on. Holding down the Shift button and clicking on a slice image will zoom out of the image at the position clicked on. Changing the slice image in any of the 2D windows will retain the current pan and zoom settings. To reset a 2D-viewing window to its default view, click the "reset view" button located at the bottom of that window. Rotating and Zooming in the 3D Window
Pressing the navigation button enables navigation in the 3D window. When the left mouse button is pressed and held in the 3D window, moving the mouse will rotate the segmented data set about the center of the image. The right mouse button allows zooming in the 3D window. Click and hold the right mouse in the 3D window. To zoom into the object, drag the mouse upwards. To zoom out, drag the mouse downwards. The middle mouse button, if available, allows the user to pan the segemented data when it is pressed and held down while the mouse is moved within the 3D window. To reset the 3D-viewing window to its default view, click the "reset view" button, located at the bottom of the 3D window.
Drawing ModesThe polygon region is not actually added to a segmentation until one presses the 'accept poly' button. It is important to understand the three drawing modes that affect how color labels are applied when this button is pressed.
Drawing and Editing Polygons
Drawing a polygonIn IRIS, the user segments a structure or applies a color label by drawing a polygon outline. Select the polygon drawing tool above to begin polygon drawing. Draw a polygon by left-clicking the mouse to create points on the perimeter of the polygon. After the last point has been created, right click to close the polygon. A green bounding box will appear around the polygon and the vertices will change color to green. An incomplete polygon may not be deleted. Only one 2D window may contain a complete or incomplete polygon at a time. (Note: this program allows self-intersecting polygons.) Editing and moving a polygonOnce a closed polygon is present, the user may edit its shape by selecting single vertices or groups of vertices and moving them to a desired position. To select a vertex, first deselect all vertices by clicking outside of any bounding box present in the current window. Then either click directly on a vertex or draw a bounding box around it by clicking and holding down the left mouse button and dragging the mouse. Multiple vertices may be selected by using this bounding box method. To move a selected vertex or set of vertices, click and hold down the left mouse button inside of the box containing the vertex(or vertices) and move the mouse to position the vertex or vertices as desired. The entire polygon can be moved using this method. To select additional vertices to the one(s) already highlighted, hold down the SHIFT key and use the left mouse button to select a vertex or draw a bounding box around a set of vertices. To deselect a vertex or set of vertices while maintaining the selection of others, hold down the SHIFT key and use the right mouse button to deselect a vertex or draw a bounding box around a set of vertices to be deselected. Inserting new verticesVertices may be inserted into the current polygon by selecting consecutive vertices and pressing the INSERT key on the keyboard. A new vertex will be placed in the middle of the line formed between the two vertices around it. A new vertex will be placed between any two consecutive vertices selected when the INSERT key is pressed, so if the entire polygon is selected, a new vertex will be placed in the middle of each line that defines that polygon. If only two vertices remain and are selected, pressing the INSERT key will place two vertices on the line between the already exisiting vertices, creating a four-sided polygon. Deleting vertices and polygonsVertices may be deleted by using the DELETE key on the keyboard while the vertices are selected. The polygon will close itself when vertices are deleted by reconnecting the remaining vertices in the order that they were placed. IF every vertex is selected, the entire polygon will be deleted. If all but one or two vertices are deleted, the polygon becomes invalid and the remaining point(s) must be deleted before a new polygon may be drawn, or new vertices must be inserted between two remaining vertices. During polygon creation, if any of the other buttons or menu items are selected, the polygon in progress is retained. This allows the user to change the view paramaters of any window for facilitating segementation. Clearing VoxelsVoxels in the segmentation can be cleared by drawing over them with the 'clear' color label, which is always the first label in the pop-down list of color labels. The 'PaintOverOne' drawing mode above allows one to clear voxels of only one color. Polygon CacheOnly one polygon can be drawn at a time, so the 'accept poly' button must be pressed before moving to a new polygon. When one presses this button, the polygon disappears but is cached in a 1-polygon cache for the current window. The cached polygon can be pasted back into any cross section of 2D view it was created in by using the associated 'paste' button. (One cannot paste into the other 2D views - each view has its own separate 1-polygon cache). This feature is available to simplify segmenting along one of the cross section directions. The polygon used in one cross section can be pasted into the next and edited point by point, since this may be faster than creating a new polygon.
Spray Painting in 3-DClicking the 3D paint/draw mode button allows the user to spray paint on the surface of the 3D objects, as well as define planes in 3D with which to relabel the visible data set. The visibility toggle is used to restrict painting and drawing to affect only those objects which are already visible. 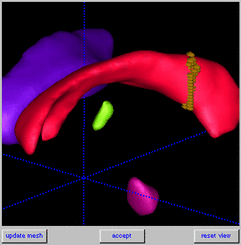 Spray painting in 3D is an extension of point selection. Simply hold the left button down and drag the mouse; dots will be spray painted on the visible objects. Note that these dots are only a visualization aid; the segmentation data set will not be modified until the 'accept' button in the 3D window is pressed. Also note that the dots may not lie precisely on the surface of the 3D objects, depending on the surface smoothing settings. This will relabel the selected voxels on the surface of the visible objects with the current drawing color. The modifications to the segmentation data will not be reflected in the 3D window until the 'update mesh' button is pressed. The 'reset view' button will cancel any uncommitted spray painting, removing the spray painted dots. Defining Cut Planes
|