 |
|

The intracerebral vasculature is enormously complex. Operations on tumors
and vascular lesions are difficult partially because surgical excision
requires interrupting the lesion's blood supply. However, some supplying
arteries may have child branches supplying normal brain. If such a parent
vessel is interrupted, the patient may suffer a stroke. The complex, connected
vascular network is very difficult to visualize in 3D.
Unfortunately, no clinical imaging method provides the requisite 3D
vascular parent-child information. It is important to develop methods for
displaying complex vascular anatomy to illustrate vessel connectivity.

Blood vessel supplying a tumor (left) and blood vessel supplying both
tumor and normal brain (right). Intraoperatively, it can be enormously
difficult to distinguish one from the other. |
|
|
|
|
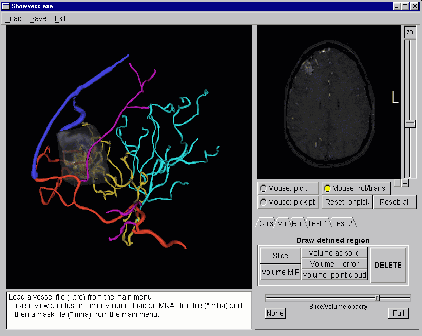
Surgical planning interface showing a volume-rendered AVM nidus and
a color-coded vascular tree supplying it. Slice data is shown in the window
at right. The patient has a frontal AVM supplied by a single carotid circulation.

Other visualizations include display of color-coded vessels against
MRA slice data, or as projected against a digital subtraction angiogram
(DSA) of the same patient. The patient is the same as shown immediately
above.

Click for larger view.
Complex AVM fed by multiple trees.
A. Vessels alone.
B. The blue carotid tree has been removed with a single point
and click. The volume-rendered nidus is also shown, with arrows indicating
passage of vessels into the nidus.
C. Volume rendered nidus at full opacity.
D. Automatic determination of potential feeding vessels (red). |
|
|
|
|
Aylward SR, Pizer SM, Bullitt E, Eberly D (1996) Intensity ridge and
widths for 3D object segmentation and description IEEE WMMBIA IEEE 96TB100056,
131-138.
Bullitt E, Liu A, Aylward SR, Soltys M, Boxwala A, Rosenman J, Pizer
S (1997a) Methods for displaying intracerebral vascular anatomy. Am J Neuroradiol
18:417-420.
Bullitt E, Aylward S, Liu A, Stone J, Mukherji S, Coffey C, Gerig G,
Pizer SM (1999) 3D graph description of the intracerebral vasculature from
segmented MRA and tests of accuracy by comparison with x-ray angiograms
IPMI 99 Lecture Notes in Computer Science 1613:308-321.
Bullitt E, Liu A, Aylward S, Coffey C, Stone J, Mukherji SK, Muller
K, Pizer SM (1999) Registration of 3D vessels with 2D digital angiograms.
Clinical evaluation.. Academic Radiology 6: 539-546. |
|
|